How many years of shoreline imagery before a retreat rate holds up?
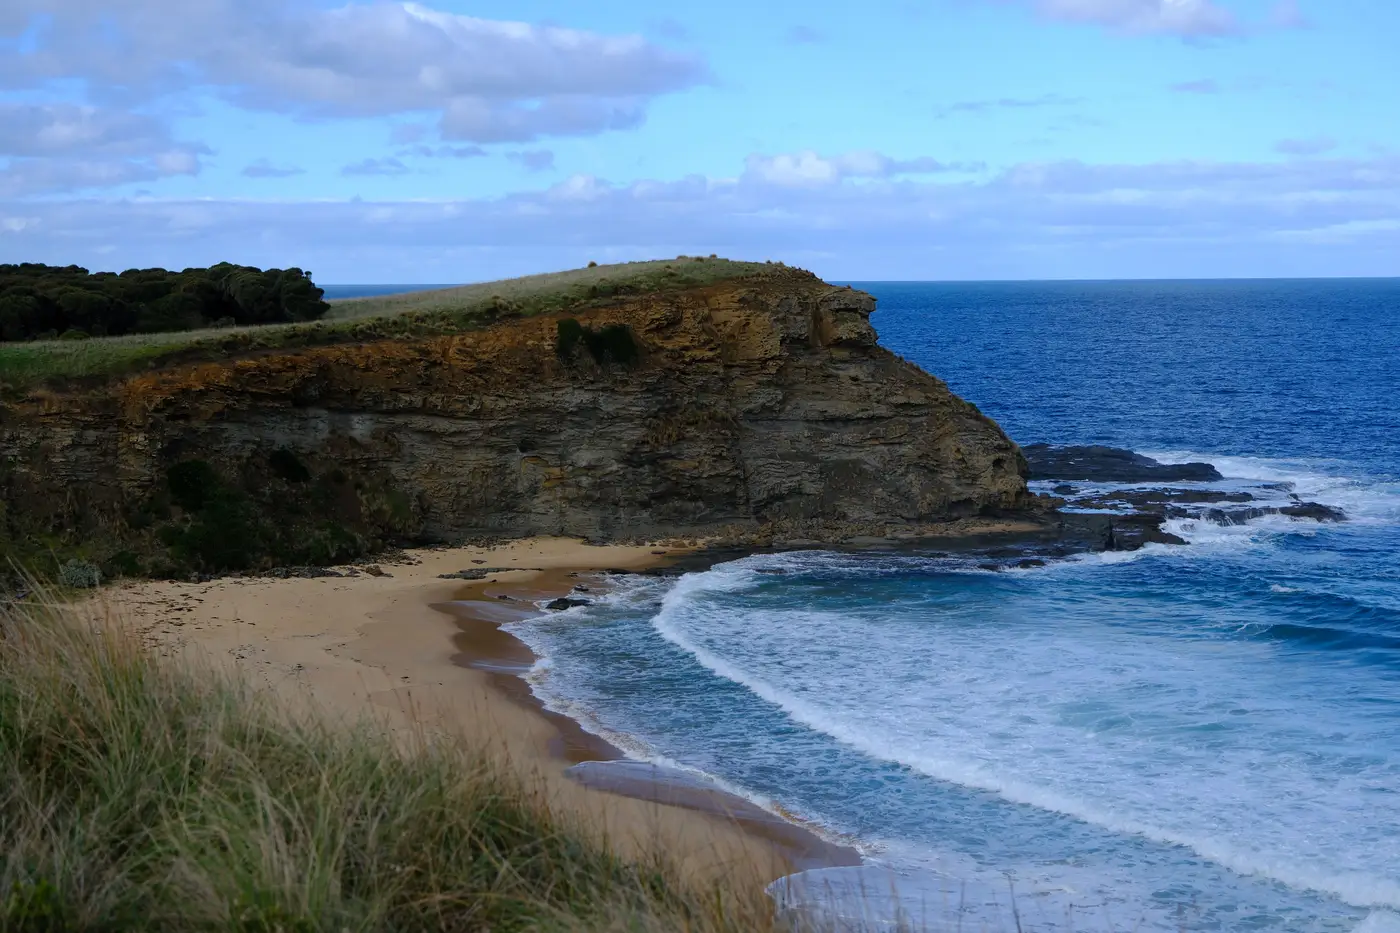
A retreat rate is a slope. Pull three or four years of shoreline positions for a transect, fit a line through them, and you'll get a number: 1.2 meters a year, say. The problem is that number can swing wildly depending on which year you happened to start and stop on, especially if one of those years had a nor'easter sit on the coast for three days.
Why short records lie to you
Shoreline position moves for a lot of reasons that have nothing to do with the long-term trend: a storm that stripped the upper beach the month before your fall flight, a sandbar that migrated onshore and fattened the dry-beach width, seasonal swings between summer accretion and winter erosion that can be meters wide on a sandy coast. All of that noise sits on top of whatever the actual retreat or accretion signal is.
With two or three data points, you can't tell the signal from the noise. You can only draw a line between them and report its slope as if it meant something. Coastal geomorphologists have been flagging this for decades, going back to work by Rob Thieler, Asbury Sallenger, and others at USGS in the 1990s and 2000s. The commonly cited floor is somewhere around 20 to 25 years of shoreline positions before a linear regression rate (LRR) stabilizes into something you'd defend in a permit hearing or a setback ordinance. Fewer than that, and your confidence interval on the rate can be wider than the rate itself.
What the confidence interval is actually telling you
When you run a linear regression through a set of annual shoreline positions, most tools (DSAS being the standard one) report the rate plus a confidence interval, usually at 90% or 95%. That interval is the honest range the true rate probably falls in, given the scatter in your data and how many points you went into the fit with.
Add more years and two things happen: the interval narrows, because you have more points constraining the fit, and a single bad year stops being able to swing the whole result. A storm that temporarily knocks the shoreline back by eight meters barely moves a 25-year trend line. The same storm can flip a four-year trend line from accretion to retreat.
This is also why end-point-rate (EPR), which just divides total change by elapsed time between the first and last shoreline, is riskier than LRR over a short record. EPR has no way to average out a bad endpoint. If your most recent survey landed right after a storm, your EPR bakes that storm into the rate permanently.
What this means for how you build the record
You don't need to wait 20 years before you start measuring. Start now, keep the method consistent, and treat the early years as a baseline you're building toward statistical reliability rather than a finished answer. A few things matter more than people expect:
- Same season, every year. Comparing a March waterline to a September waterline from a different year adds a seasonal signal you didn't ask for.
- Same tide stage, roughly. Waterline position shifts with tide level independent of actual shoreline change.
- Same extraction method. If you digitize the waterline by hand one year and run an automated classifier the next, the inconsistency shows up in your rate as apparent change that isn't real.
That third point is where most county and regional coastal programs lose the thread. Budget cycles mean the person doing the digitizing changes, the imagery source changes, the resolution changes, and five years later nobody can say whether the apparent 0.8 meter jump is real erosion or a methods artifact.
That's the gap a consistent annual pass closes: run the same extraction against the same high-resolution multispectral imagery every year, on the segments you've already defined, and the record builds itself without someone re-digitizing a waterline by hand each cycle. Shoreline Change is built around exactly that, an annual waterline layer and a per-segment rate that gets more statistically solid every year you add to it, rather than a one-off snapshot you have to recompute from scratch.
If your agency is still a few years into its own record, it's worth seeing what that annual layer looks like for your coast.